تشميس
التشميس (بالإنجليزية: Insolation) هو مقياس لطاقة الإشعاع الشمسي المستلمة على مساحة معينة وسجلت خلال وقت معين. ويسمى أيضا الإشعاع الشمسي. والوحدة التي أوصت بها المنظمة العالمية للأرصاد الجوية هي الميغاجول للمتر المربع الواحد(MJ/m2) أو جول في كل مليمتر مربع (J/mm2).[1] الممارسين في مجال الطاقة الشمسية ممكن أن يستخدموا وحدة واط ساعة للمتر المربع الواحد (Wh/m2). إذا تم تقسيم هذه الطاقة حسب وقت التسجيل في ساعات، تسمى كثافة الطاقة حينئذ التشيع، التي يعرب عنها واط لكل متر مربع (W/m2).
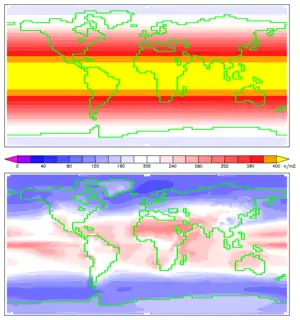
Annual mean insolation at the top of Earth's atmosphere (top) and at the planet's surface
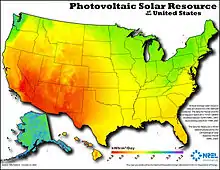
US annual average solar energy received by a latitude tilt photovoltaic cell (modeled)
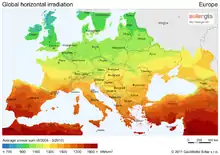
Average insolation in Europe
تشميس الأرض
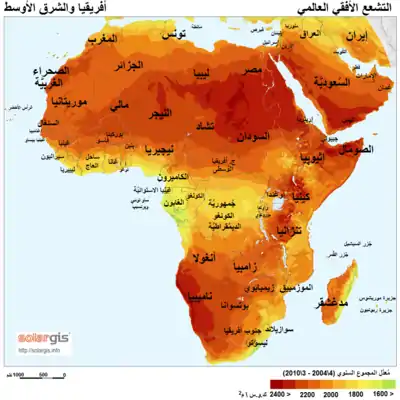
Solar radiation map of Africa and Middle East

A مقياس الإشعاع السماوي, a component of a temporary remote meteorological station, measures insolation on Skagit Bay, واشنطن (ولاية).
توزيع التشمس في الجزء العلوي من الغلاف الجوي
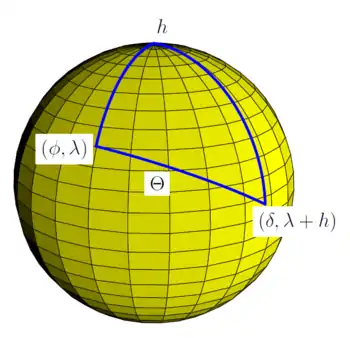
Spherical triangle for application of the spherical law of cosines for the calculation the solar zenith angle Θ for observer at latitude φ and longitude λ from knowledge of the hour angle h and solar declination δ. (δ is latitude of subsolar point, and h is relative longitude of subsolar point).
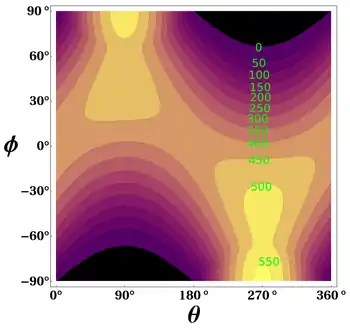
, the theoretical daily-average insolation at the top of the atmosphere, where θ is the polar angle of the Earth's orbit, and θ = 0 at the vernal equinox, and θ = 90° at the summer solstice; φ is the latitude of the Earth. The calculation assumed conditions appropriate for 2000 A.D.: a solar constant of S0 = 1367 W m−2, obliquity of ε = 23.4398°, longitude of perihelion of ϖ = 282.895°, eccentricity e = 0.016704. Contour labels (green) are in units of W m−2.

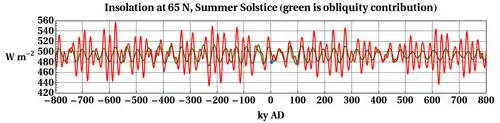
Past and future of daily average insolation at top of the atmosphere on the day of the summer solstice, at 65 N latitude. The green curve is with eccentricity e hypothetically set to 0. The red curve uses the actual (predicted) value of e. Blue dot is current conditions, at 2 ky A.D.
التطبيقات
Insolation variation by month; 1984-1993 averages for January (top) and April (bottom)
| Conversion factor (multiply top row by factor to obtain side column) | |||||
|---|---|---|---|---|---|
| W/m2 | kW·h/(m2·day) | sun hours/day | kWh/(m2·y) | kWh/(kWp·y) | |
| W/m2 | 1 | 41.66666 | 41.66666 | 0.1140796 | 0.1521061 |
| kW·h/(m2·day) | 0.024 | 1 | 1 | 0.0027379 | 0.0036505 |
| sun hours/day | 0.024 | 1 | 1 | 0.0027379 | 0.0036505 |
| kWh/(m2·y) | 8.765813 | 365.2422 | 365.2422 | 1 | 1.333333 |
| kWh/(kWp·y) | 6.574360 | 273.9316 | 273.9316 | 0.75 | 1 |
انظر أيضا
وصلات خارجية
- National Science Digital Library - Insolation
- San Francisco Solar Map
- Insolation map of Europe and Africa
- Yesterday‘s Australian Solar Radiation Map
- Net surface fluxes of solar radiation including interannual variability
- Net surface solar radiation
- Maps of Solar Radiation
- Solar Radiation using Google Maps
- Sample Calculations based on US Insolation Map
- Solar Radiation on a Tilted Collector (U.S.A. only) choose "Theoretically Perfect Collector" to receive results for the insolation on a tilted surface
- Annual Optimal Orientation of Fixed Tilt Solar Collectors (U.S.A. only)
- SMARTS, software to compute solar insolation of each date/location of earth
- Solar Radiation and Clouds - A Discussion
 بوابة الفضاء
 بوابة علم الفلك
 بوابة طاقة
 بوابة طقس
 بوابة طاقة متجددة
This article is issued from Wikipedia. The text is licensed under Creative Commons - Attribution - Sharealike. Additional terms may apply for the media files.